Cherenkov Radiation vs Power
Motivation
Conventional neutron and gamma detectors used for reactor power monitoring, such as ionization and fission chambers, face several inherent limitations, including high signal noise, susceptibility to radiation-induced degradation, and high deployment costs. Crucially, since these detectors measure flux only at specific, localized positions, accurately assessing the global reactor power becomes challenging when flux tilts or spatial asymmetries occur within the core.
These limitations motivate the exploration of non-intrusive monitoring approaches that can provide more spatially integrated signals and operate robustly even at high power levels. This study investigates Cherenkov radiation as a viable alternative for power monitoring at the UT Austin TRIGA Mk-II research reactor, evaluating the potential of using video data to estimate real-time reactor power with high precision and reliability.
Camera Setting
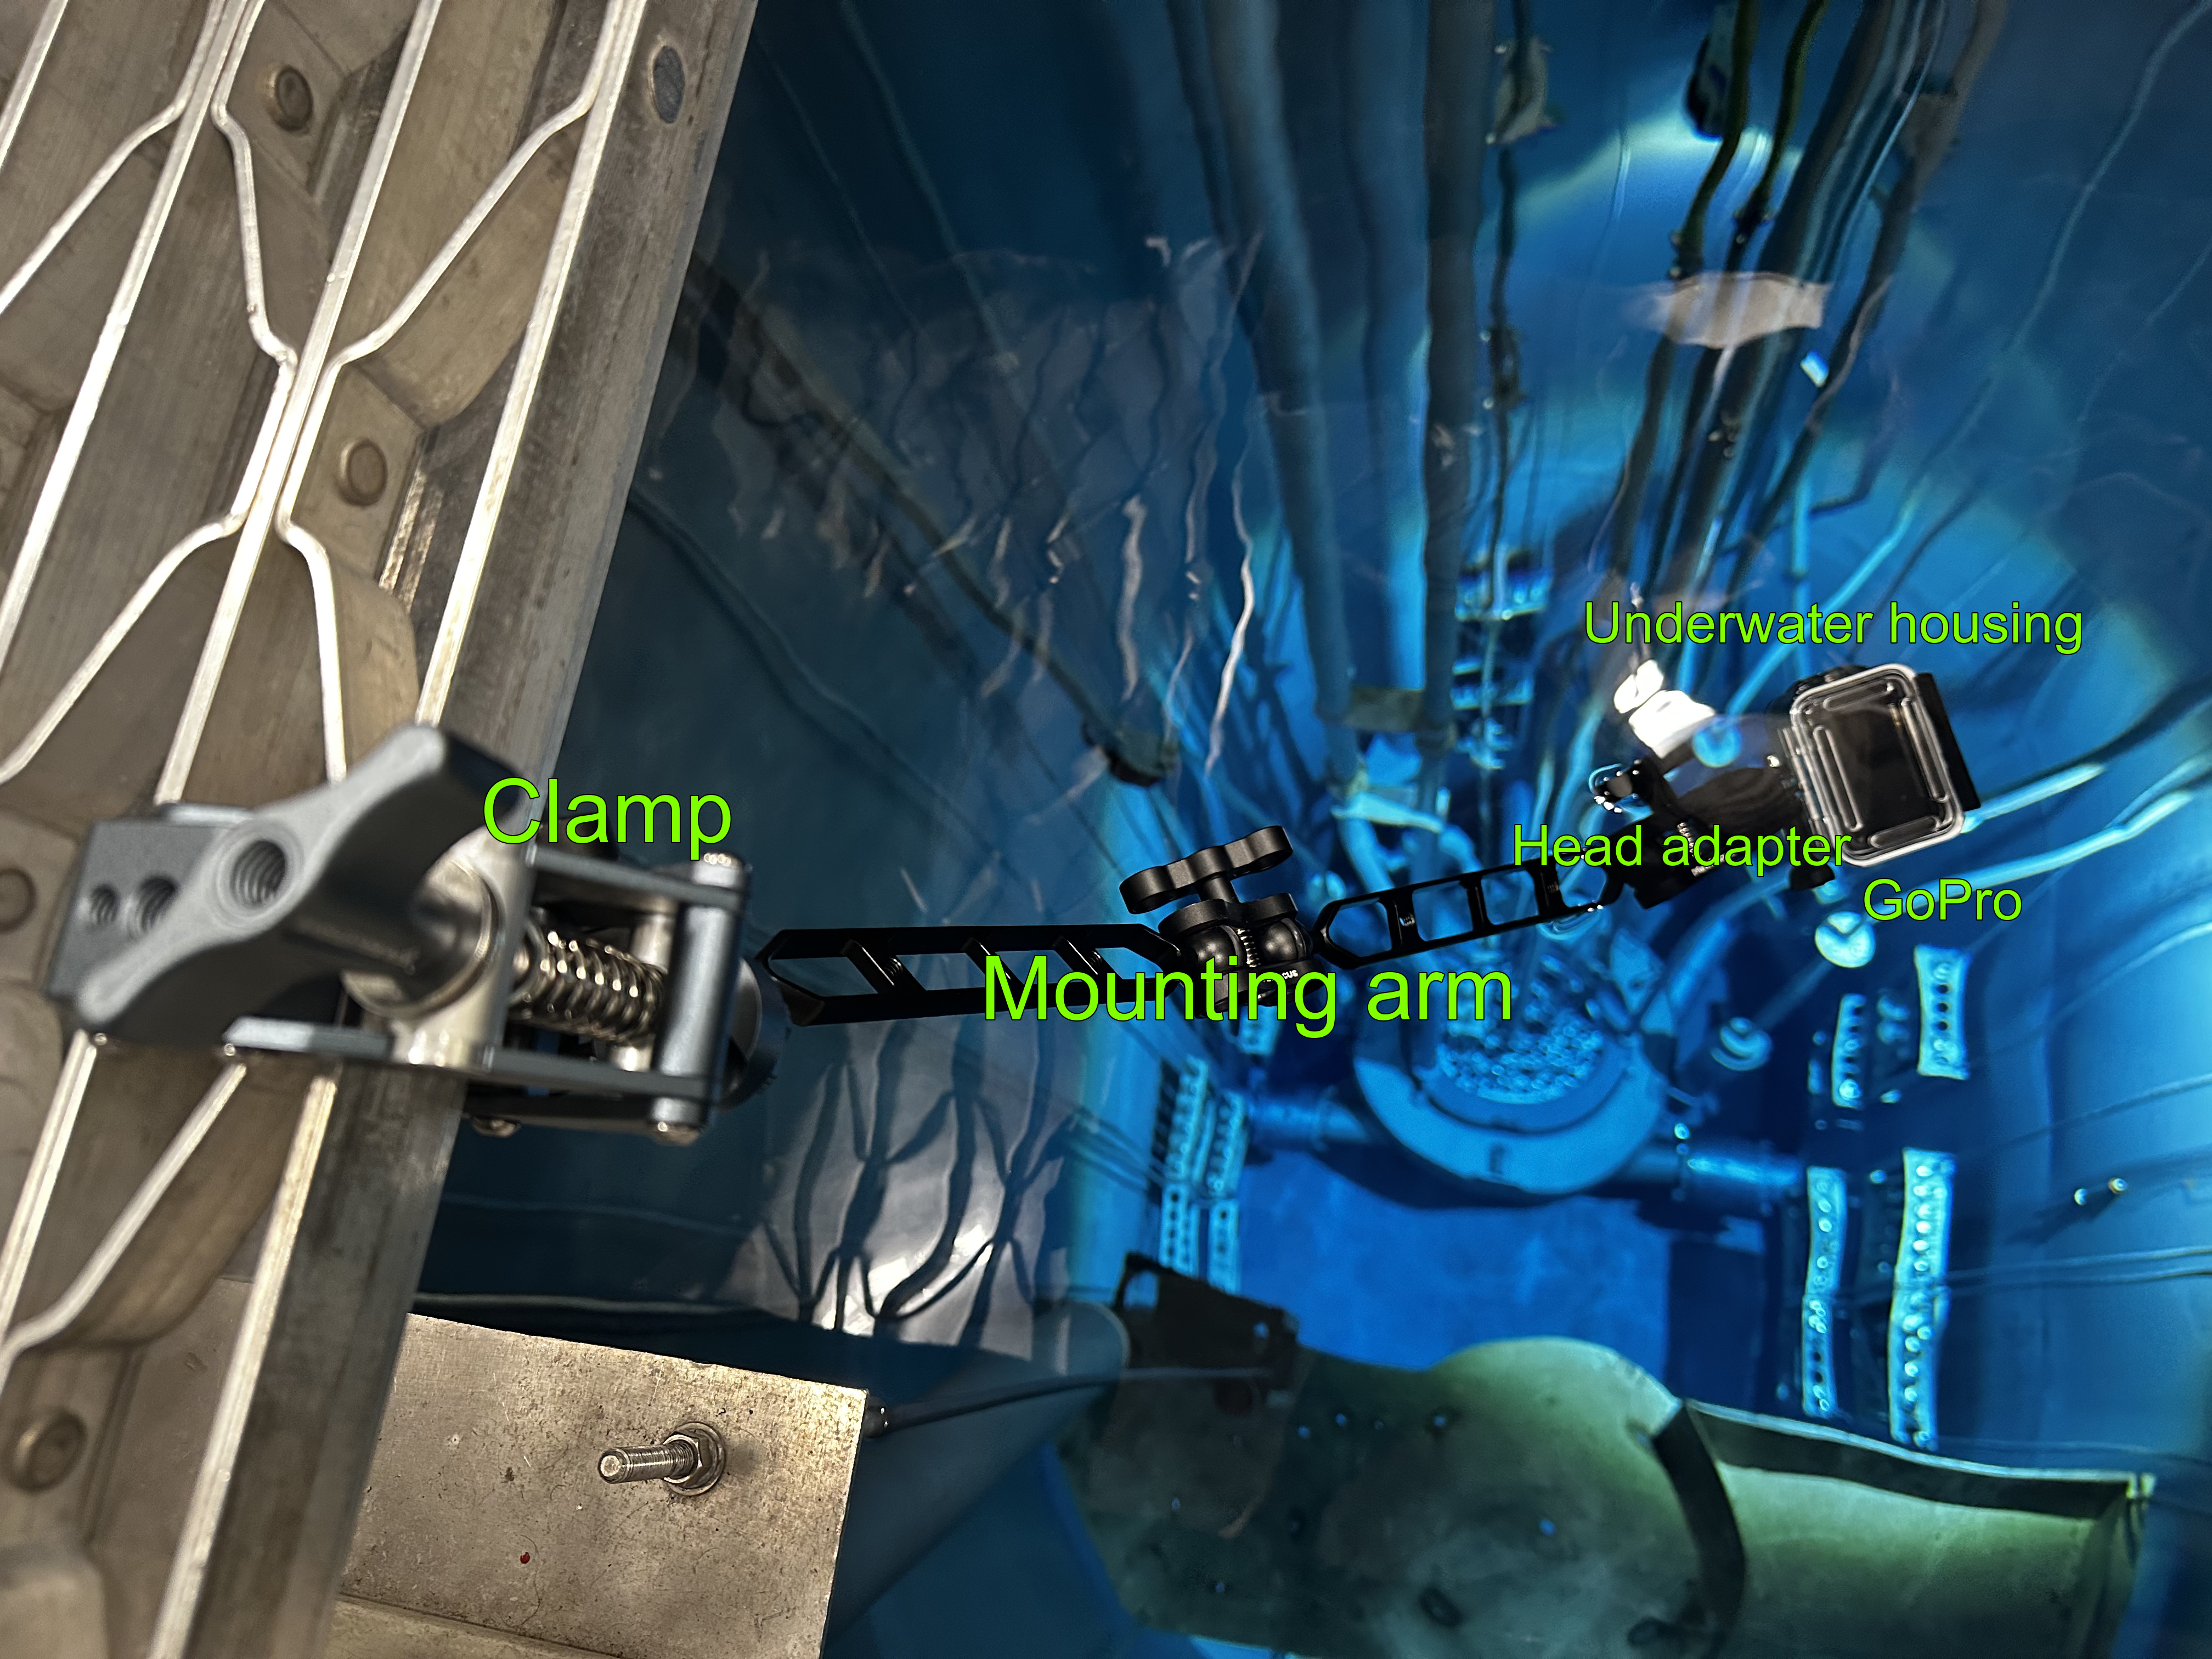
A commercial action camera, the GoPro HERO13 Black, was utilized to record the Cherenkov light emitted from the reactor core.
- Camera: GoPro HERO13 Black
- Position: Positioned just below the pool surface, oriented directly toward the reactor core.
- Resolution & Frame Rate: 5.3K resolution at 30 FPS.
- Technical Settings:
- Color Profile: 10-bit Log (GP-Log) to ensure a wide dynamic range.
- ISO: Set between 100–400 to minimize electronic noise.
- White Balance: Fixed at 6500K for consistency across different power levels.
Method
Step 1: Preprocessing
The raw high-resolution video is first cropped to a specific Region of Interest (ROI) centered on the reactor core. To enhance signal quality, a spatio-temporal denoising filter (hqdn3d) is applied via FFmpeg. From the processed frames, the mean pixel intensity for each color channel (RGB) is calculated, converting the video into a time-series optical signal.
Step 2: Synchronization
The optical intensity data is aligned with the actual reactor power data recorded by the console. Time synchronization is primarily achieved using Fast Fourier Transform (FFT) analysis to precisely match timestamps, particularly when the reactor reaches a steady-state power level (e.g., 950 kW). This ensures that each frame's optical intensity is accurately mapped to the corresponding physical power output of the reactor. Finally, the optical signal is scaled using a 3rd-order polynomial fit against the reactor power data.
Step 3: Noise Analysis
Based on the synchronized data, the statistical uncertainty of the system is evaluated. The noise levels are quantified by analyzing the standard deviation of the optical signal during steady-state operations. Furthermore, the response characteristics and linearity of the visual signals are verified during transients and pulses to validate the precision and reliability of this optical monitoring approach.
Data and software availability
More detailed research, dataset, and source code can be found at https://github.com/jay-nuclear-phd/power_by_cherenkov. This research is expected to be submitted to an academic journal in January 2026.